
How to Look Up Cobb County Jail Population Data
Cobb County jail population data lives in a few official places. The live roster runs on the Sheriff's inmate inquiry portal. That page shows the line "Matching records of individuals presently incarcerated" with a timestamp at the moment of the query. It is the closest thing to a real-time count the public can pull. The Adult Detention Center page at cobbsheriff.org lists the facility profile and capacity. Quarterly population reports under HB 1105 are posted as PDFs from the inmate search page.
National and state context comes from the U.S. Bureau of Justice Statistics jail surveys and the Vera Institute county jail data set. The BJS jail series tracks rated capacity, ADP, and admissions for jails of all sizes. The Vera Institute publishes county-level jail rates in its Incarceration Trends tool. The Sheriff data updates as bookings post. The HB 1105 PDFs update each quarter. The BJS and Vera data sets update yearly or on a multi-year cycle, so they tend to lag the live roster.
Read the live roster as a snapshot. The HB 1105 reports give a quarterly view. BJS and Vera give the long view.
Cobb County Jail Capacity Overview
The Cobb County jail complex has 3,077 official beds. The complex sits at 1825 County Services Parkway in Marietta and runs to about one million square feet under roof. It is built as three connected towers, A, B, and C. The Sheriff's Office lists the role as pretrial, with custody of both pretrial and sentenced detainees. The Sheriff page on the Adult Detention Center gives the facility profile and links to inmate services. Visit days and modified rules are posted there. The Sheriff's jail history page walks through how the complex was built out over three decades.
The first tower, Building A, was finished in 1987 at $13.5 million. Building B was added in 1997 at $39.2 million. C Tower came online in 2010 at $110 million, paid for with a special sales tax. The Detention Division also runs a Work Deployment Facility and an Annex. Separate bed counts for those two units are not listed on public Sheriff pages.
Capacity for Cobb County jail population data is reported as a single combined figure across the three towers. Per-tower bed counts are not published.
For context on how the Sheriff's site presents the jail, see the lead-in image below. The Adult Detention Center division page is the main official entry point for jail facts.
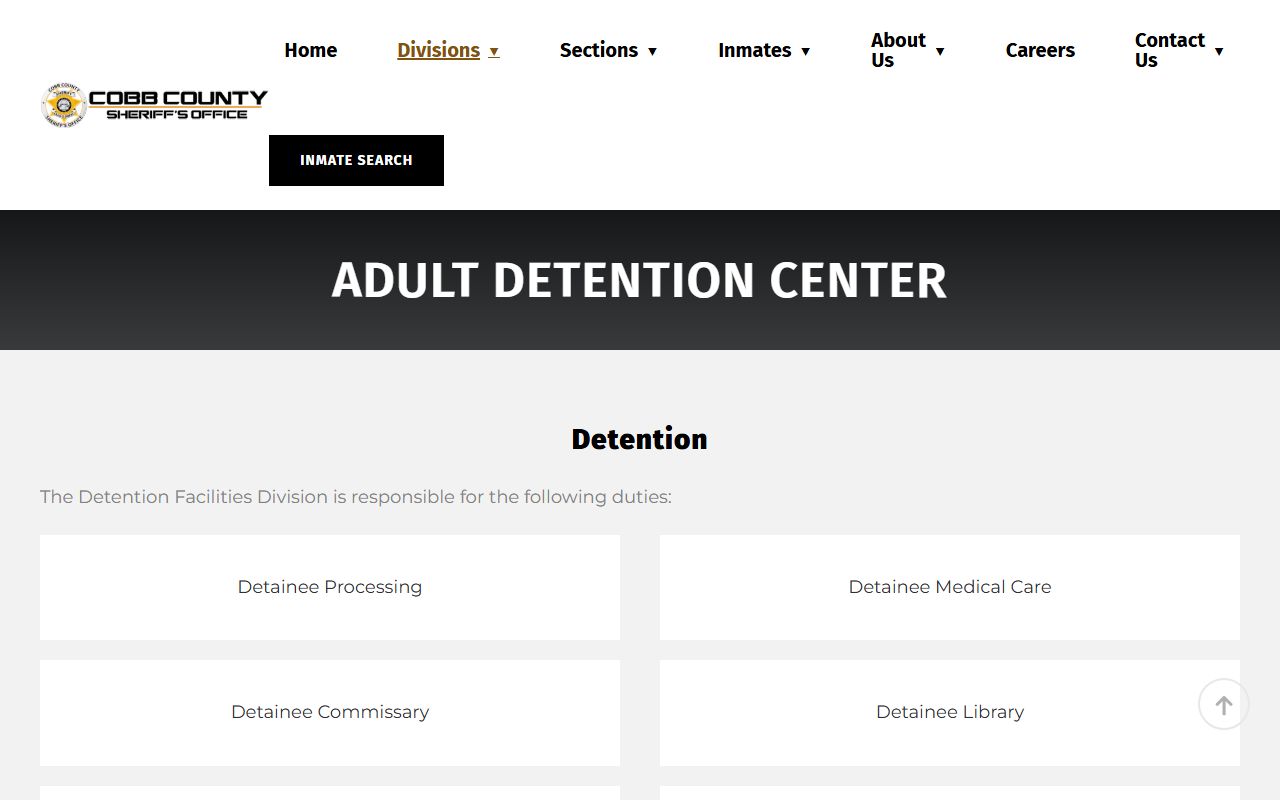
That page is the source for the 3,077-bed figure used across Cobb County jail population data tables.
| Facility / Tower | Rated Beds | Year Opened |
|---|---|---|
| Building A (original tower) | Included in 3,077 | 1987 |
| Building B (expansion) | Included in 3,077 | 1997 |
| C Tower | Included in 3,077 | 2010 |
| A + B + C combined | 3,077 | Total official capacity |
| Work Deployment Facility / Annex | Not published | n/a |
Average Daily Population
Average daily population, or ADP, is the mean count of people held in a jail across a year. It is the figure most often used to compare jails of different sizes. Cobb County does not publish an ADP dashboard on the Sheriff's main site. The Sheriff inmate inquiry shows the count of matching records at the moment a search is run, not a rolling average. That live snapshot can sit thousands of beds below rated capacity at one hour and shift hundreds higher the next.
To get a true ADP for Cobb County jail population data, three sources can be combined. Quarterly HB 1105 reports posted by the Sheriff give a structured count tied to state reporting. BJS Annual Survey of Jails publishes ADP for large jails like Cobb. Vera Institute Incarceration Trends tracks county ADP and rate per 100,000 going back to the 1970s. Numbers from these sources lag the calendar by a year or more.
For day-to-day work, treat the live Sheriff snapshot as the current count. Treat BJS and Vera as the audited long-run series.
Demographic Breakdown
Demographic data for Cobb County jail population data is not posted in one ready-made chart on the Sheriff's site. The live inmate inquiry shows race and sex on each result line, and the booking detail page shows race, sex, year of birth, height, weight, hair, eyes, address, city, state, ZIP, and place of birth. Pulling that into a county-wide demographic breakdown takes either an open records request or use of the BJS and Vera county data sets that already do the aggregation.
The fields that appear on the public inmate inquiry are listed below. These are the building blocks the Sheriff uses for any internal demographic count, and the same fields BJS asks for in its annual jail survey.
| Field | Source |
|---|---|
| Race | Inmate inquiry results column |
| Sex | Inmate inquiry results column |
| Year of Birth | Inmate inquiry results column |
| Height, Weight, Hair, Eyes | Booking detail page |
| Address, City, State, ZIP | Booking detail page |
| Place of Birth | Booking detail page |
| Days in Custody | Inmate inquiry results column |
Per the Sheriff's notice, booking photos are no longer posted to the public site under O.C.G.A. § 35-1-19. That is a public-facing limit, not a data-collection limit.
Pretrial vs Sentenced Population
The Cobb County Adult Detention Center holds both pretrial detainees and sentenced detainees. The Sheriff's own pages describe the facility as pretrial in role while also stating that the Detention Division has custody of both pretrial and sentenced people. That dual role is normal for a large county jail. State prison terms past a year run through the Georgia Department of Corrections, not the county jail.
National jail data from BJS shows that county jails sit far higher on the pretrial side than the sentenced side. The exact Cobb split is not posted as a single public number. The breakdown below uses the categories the Sheriff and BJS both use, with the actual percent left blank until pulled from a current HB 1105 quarterly report or BJS survey response.
| Custody Status | Share of Population | Source |
|---|---|---|
| Pretrial (awaiting trial or plea) | Not published locally | HB 1105 / BJS |
| Sentenced (serving county time) | Not published locally | HB 1105 / BJS |
| Holds for other agencies | Not published locally | Sheriff records |
For an active case, the live booking detail page shows whether bond has been set, the bond amount, and any release date. Those fields, taken across the full roster, are how a pretrial share is built.
Misdemeanor vs Felony Population
Each charge listed on a Cobb booking detail page comes with a code section, a short description, a type field, a count, and a bond figure. The type field is what marks a charge as a misdemeanor or a felony. Across the full roster, the share leans felony, because most low-level misdemeanor cases either cite-and-release or post bond fast and clear the jail. Serious felony cases tend to sit longer on pretrial status, which pulls them into the snapshot count.
The Sheriff does not publish a single misdemeanor-vs-felony percent on the live site. The data exists in the booking records and could be summed from the public inmate inquiry. BJS publishes broad charge-type splits for large county jails, which can act as a check against any Cobb-specific number pulled from local sources.
Mental Health and Medical Population
The Detention Division runs a medical unit on site. The Sheriff lists Medical Unit at 678-355-7079 on its public contact directory. The unit handles intake screening, ongoing care, prescriptions, and mental health crises for the jail population. A share of the Cobb County jail population each day sits in medical or mental health housing rather than general population. The exact percent is not published on the public Sheriff site.
National jail data tracks mental health load as a key population trend. BJS reports show that more than a third of jail inmates have a history of a mental health condition. Vera Institute studies on county jails make a similar point. Cobb's medical unit and the booking process feed into that picture, even where local numbers stay internal.
National and State Context
Cobb County is one of the larger county jail systems in Georgia by rated bed count. Georgia jail counts in total run well above the national per-capita rate, per BJS annual jail reports. The Vera Institute Incarceration Trends tool gives a county-by-county view that puts Cobb against state and national averages. Cobb-specific jail rate per 100,000 residents is not posted on the Sheriff site. The numbers below come from the BJS and Vera reporting series and should be pulled from those sources for the current year before any rate comparison is published.
| Level | Jail Population Rate per 100,000 | Source |
|---|---|---|
| Cobb County | Pull from Vera Incarceration Trends | Vera Institute |
| Georgia (statewide) | Pull from BJS state jail data | BJS |
| United States | Pull from BJS national jail data | BJS |
Note: county rate, state rate, and national rate per 100,000 should be cited only with the source year, since these figures shift year to year and lag the live jail count.
Population Trends Over Time
The long view of Cobb County jail population data is best read through the lens of the facility's own build-out. The old high-rise jail was capped at 128 beds by a federal court order in the years before the modern complex. That order forced remote housing and pushed the county to a bond referendum for a new jail. Building A opened in 1987 at 13.5 million dollars. Building B added beds in 1997 at 39.2 million dollars. C Tower took the count to 3,077 in 2010 at 110 million dollars. The Sheriff jail history page tracks that arc.
For a look at how the Sheriff documents the long-run trend, see the jail history page screen below.
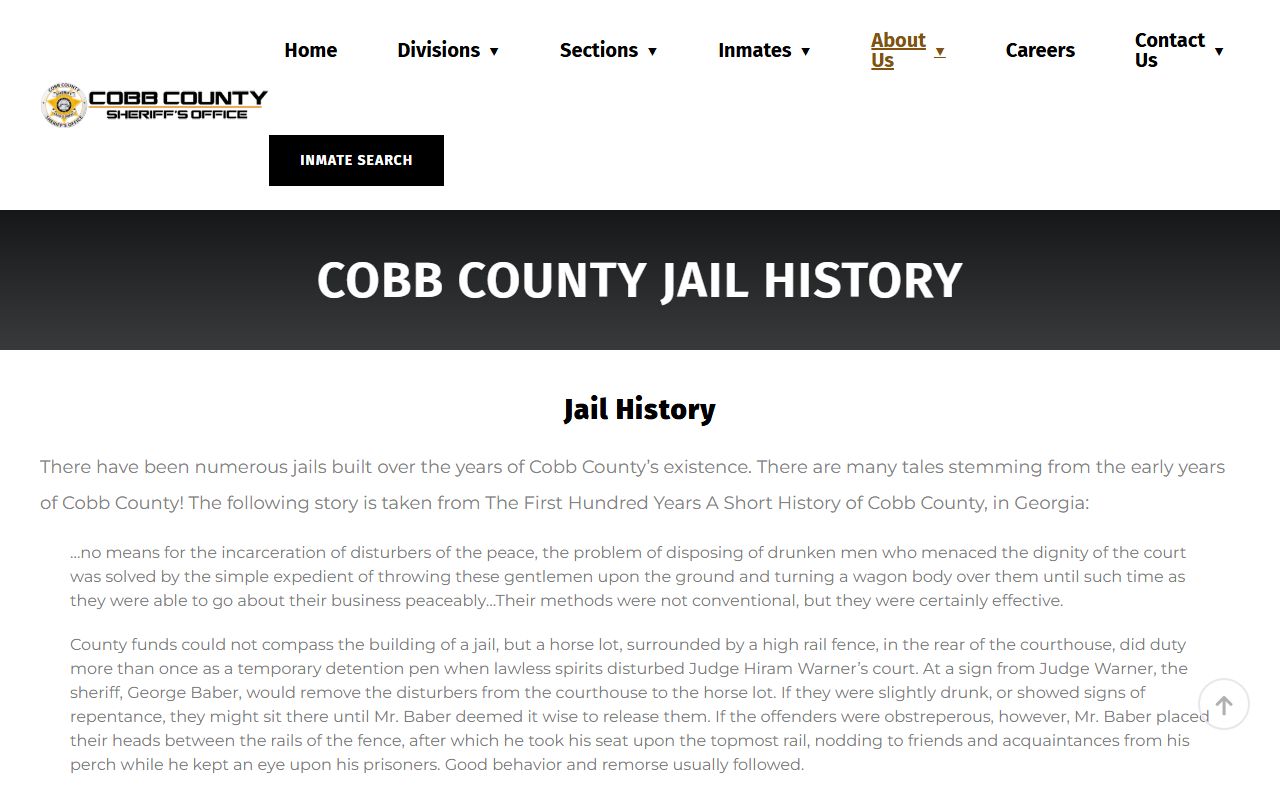
That page is the cleanest single source for capacity history. It does not show a year-by-year ADP series. For that, pull Vera's Incarceration Trends export for Cobb County.
Modern trends to watch include the share of pretrial detainees, the medical and mental health share, and quarterly HB 1105 reporting under the Georgia Criminal Alien Tracking and Reporting Act. The Sheriff posts those quarterly reports as PDFs from the inmate inquiry landing page.
Searching for Cobb County Inmate Records by Name
This page covers Cobb County jail population data in aggregate. For a name-by-name lookup of who is held right now, use the Cobb County inmate records page. For people recently let out of custody, see released inmates. For active orders that may bring a person into the jail next, check warrant records. For court filings tied to a charge, use criminal records.
Where the Data Comes From
Cobb County jail population data pulls from four official streams. The first is the Sheriff's live inmate inquiry, hosted at inmate-search.cobbsheriff.org and linked from the Adult Detention Center page. The second is quarterly HB 1105 reporting under the Georgia Criminal Alien Tracking and Reporting Act, posted as PDFs from the inmate search page. The third is the Sheriff's Office annual report and budget documents, which set out staffing and capacity. The fourth is the long-run national jail series from BJS and the county data set at the Vera Institute.
Each source has a clear use. The live roster is best for a single-day count. The HB 1105 quarterly reports give a structured number tied to state reporting. BJS gives the audited national series. Vera gives the county rate per 100,000. The Sheriff jail history page is the source on capacity build-out.
Note: any specific Cobb County jail population data point cited from a PDF report should include the report year and the quarter, since HB 1105 numbers shift each quarter.